Tick-level data engine
Simulations use tick-by-tick price data, not resampled bars. Spread and slippage are modeled using historical broker feed samples so your fill estimates are grounded in real market conditions.

Backtesting
Run a full historical simulation before you put a single leu at risk — tick-level data, real spread modeling, and a detailed breakdown of every metric that matters.
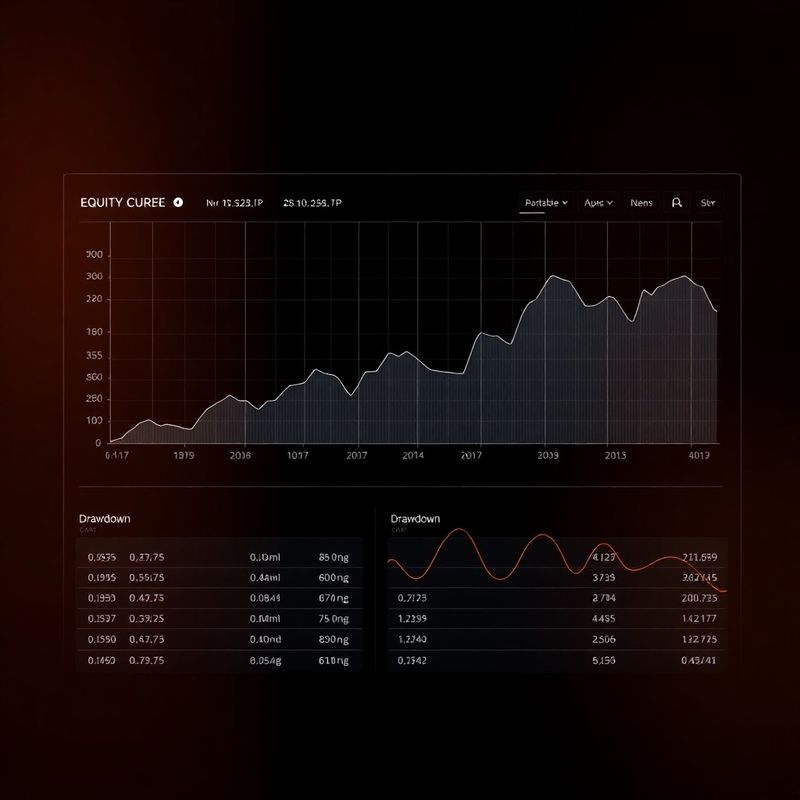
A backtest is a simulation of how your strategy would have behaved on historical market data. At Coastal Collective the backtesting engine uses tick-level data (not daily OHLC bars) to model entries and exits as precisely as possible, including spread costs and partial fills. You submit your strategy, select the asset, timeframe, and date range (up to five years back), and the engine runs the full simulation. The output report shows trade-by-trade detail, cumulative equity curve, maximum drawdown, average hold time, win rate broken down by session and day of week, and Sharpe and Calmar ratios. Backtesting reveals weaknesses in your logic before they cost real capital — but it is not predictive of future results and we never present it as such.
Every simulation produces a downloadable PDF and CSV. Here's what the report covers.
Simulations use tick-by-tick price data, not resampled bars. Spread and slippage are modeled using historical broker feed samples so your fill estimates are grounded in real market conditions.
Maximum drawdown, drawdown duration, and recovery time are calculated per strategy run. You can see exactly which calendar period was the worst — and whether your risk rules would have contained it.
Sharpe, Calmar, and Sortino ratios are computed automatically. Win rate, profit factor, and average R:R are broken down by session (London, New York, Asia) and by weekday.
Every backtest report exports as a formatted PDF for review and a structured CSV for your own further analysis. Reports are stored in your account for 90 days.
Log in, navigate to the Backtesting module, and select the strategy you want to evaluate — either one you have already uploaded to the platform or a new script submitted just for testing. Choose the asset pair or instrument, the date range, and the account parameters (starting capital, leverage limits). The engine queues the run and typically delivers results within two to eight minutes depending on the date range and trade frequency of the strategy. Once complete the report appears in your dashboard and is emailed to your registered address. You can run unlimited backtests on the Pro and Business tiers; the Start tier includes five runs per calendar month.
Create an account, upload your strategy, and get a full backtest report — no commitment required to start.
Get started